Beware of the Writing on The Wall – Part 4 - The Aftermath
By Mike Fortunato, CIM®, FCSI®
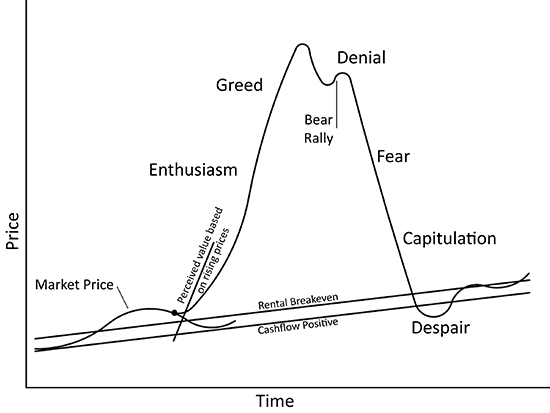
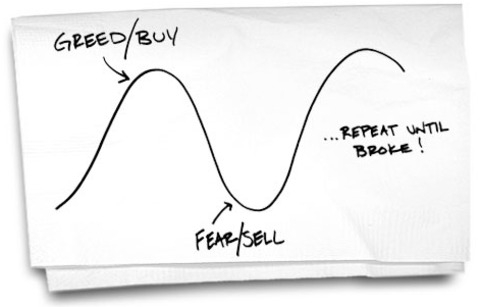
image:https://econompicdata.blogspot.com/2010/08/housing-greed-fear-bottom-cycle.html
In the previous two instalments of this article I described how the rollercoaster ride investors experienced (as the market peaked in 2007 and subsequently nosedived in 2008) was foreshadowed by posters displayed in several bank branches throughout Ontario, where I worked as a teller at the time. Ironically, the investment products promoted in both posters were ill-timed for many investors to take advantage of their benefits:
- First, equity mutual fund posters arrived in the late summer of 2007. Although the funds had terrific past performance, they were doomed to experience substantial declines as the market eventually collapsed a few months after their posters went on display.
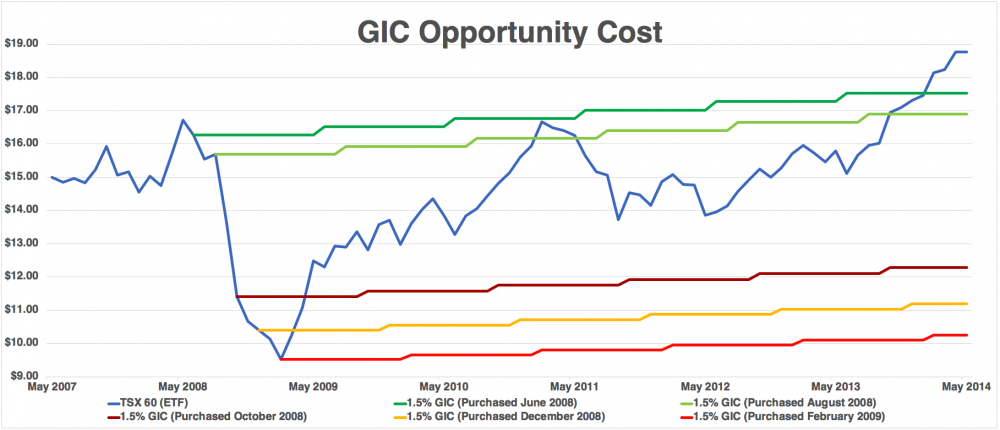
- Then, in the middle of 2008, as the market continued to crumble, GIC posters were displayed, which were too late to protect many investors from losses that occurred earlier in the year. Also, investing in GICs in late 2008 came with a huge opportunity cost by tying up investor’s funds (at extremely low yields) just a few months before the market was destined to being its multi-year rebound.
In this last instalment I’ll describe how investors were thrown one final loop-de-loop in this rollercoaster ride, that again involved yet another untimely poster (as the market was beginning its recovery in 2009).
Before I lift the curtain on the final act of this real-life drama, I want to give you some background about my disposition, at the time this was unfolding. A few years before joining the bank I had begun studying economics and wealth management as a hobby. I was particularly interested in the concepts of investor psychology and the field Behavioural Finance. At the time, I was actually more concerned with trying to become an investor verses trying to find a career in the finance industry. I spent much of my spare time consuming the financial news, reading books about investing, and testing various strategies in the markets. I continued studying while at work too, as I made it a habit to learn from every customer I spoke with. By viewing each customer interaction through the lens of Behavioural Finance I was able to gain huge insights about the micro-economic forces that assemble to form the macro-economic phenomenon commonly referred to as “the mind of the market”. I had certainly been in the right place and the right time in history to be studying investor psychology. First, I witnessed how flashy historical returns, displayed in our equity mutual fund’s poster, played on the emotion of greed and enticed many investors to go ‘all-in’ near the top of the market. Then, as the market reversed, many investors panicked as their losses accumulated and were allured to the promise of “guaranteed principal” advertised in our GIC poster. Falling victim to the emotion of fear, those that sold out near the bottom of the bear-market, to move into GICs, were also guaranteed to exacerbate their losses with an extra-long recovery due to the low yield of these ‘safe’ investments.
As 2008 was ending and 2009 was beginning, I recall reflecting on the last 18 months since becoming a bank teller in the summer of 2007. It was quite a ride. At that time many investors were still too terrified to invest in stocks because the market still hadn’t shown any signs of letting up from its one-year plunge. Looking back now in hindsight, however, it is clear that this was the best time to start investing in equities again, as the markets have been steadily rising for almost 10 years since bottoming in the early spring of 2009. I could understand investor’s fear however, to invest in stocks again, as their portfolios had been devastated the prior year. It was during this emotional time that the final poster in this saga appeared on the display wall at my branch mid-2009. It was advertising one of our bank’s bond mutual funds. Although it didn’t boast returns as strong the equity fund poster from 2007, it did showcase a mix of high-single-digit (5-year) & double-digit (3-year & 1-year) historical returns. This new bond fund poster must have shined like an oasis to many of our investors given that the other mainstream alternatives at the time were: near-zero-percent yielding GICs and a stock market that had fallen approximately 50%. In light of all the turmoil they had recently experienced in the stock market, I wasn’t surprised that about half of our clients viewed this new poster more like a mirage instead of an oasis. But those that weren’t skeptical actually viewed this bond fund as a better alternative than GICs to claw back all the losses they had experienced.
Historically, it is rare for a bond fund of that nature to have returns as high as the past returns showcased in our poster. Leaving aside the skill of the portfolio management team (which I’m sure was great), there were two main reasons why our bond fund had such a strong 1-year, 3-year & 5-year historical return:
Interest rates had just been aggressively lowered by central banks who were trying to inject liquidity into the financial system.
Large institutional investors moved funds into government bonds in hopes of finding a stable place to ride out the storm.
Both of these factors placed tremendous buying pressure on the government bond market, which caused bond values (and many bond funds) to increase dramatically. The fact that the 1-year & 3-year return on our bond fund poster was much higher than the 5-year return, also seems to confirm that the catalyst for its strong performance occurred mainly in 2008.
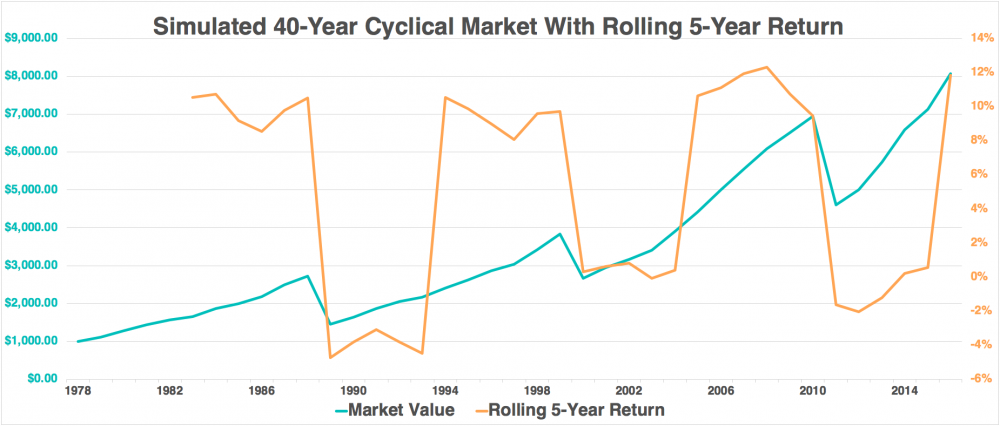
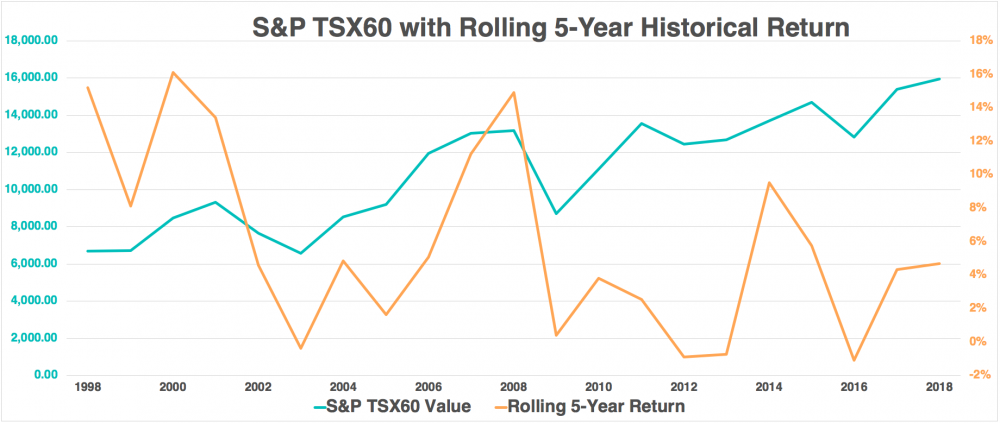
Although this fund had great historical performance, the most important consideration for new investors contemplating whether to invest in the fund or not was: how well it would perform in the future. Ironically, the dynamic between the rolling historical return of this bond fund and the cyclical nature of the bond market is very similar to the dynamic we saw in 2007 between our equity fund poster and the stock market. Sadly, many investors I talked with at the time hadn’t learned any lessons from 2007 and again shallowly focused only on the historical returns in large block print in our bond fund poster. In retrospect, those that were enticed to invest in bond funds like this one, in mid-2009, performed okay, but their return was much closer to the historical norm one might expect from a bond fund (as opposed to the double-digit returns they were hoping for). It’s also important to remember that many of these investors saw this bond fund as their ticket to redemption and hoped it would help restore their portfolios to their former glory. Below is an image to help illustrate why their intuition was incorrect:
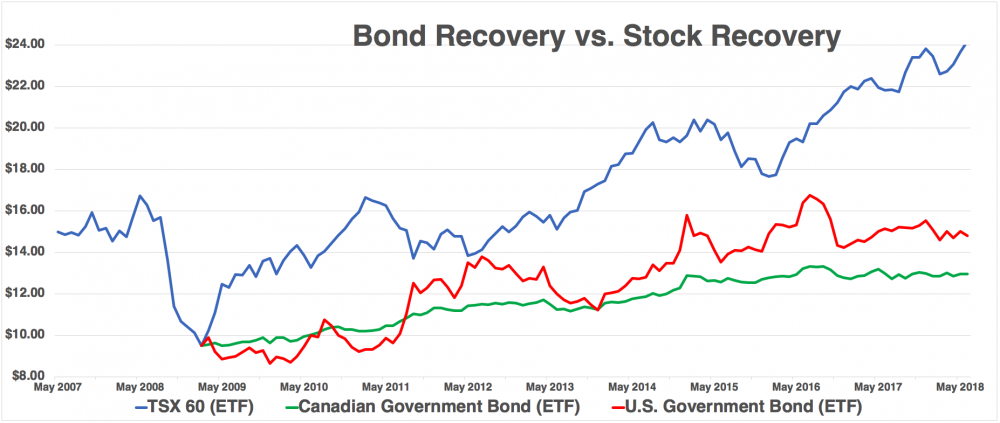
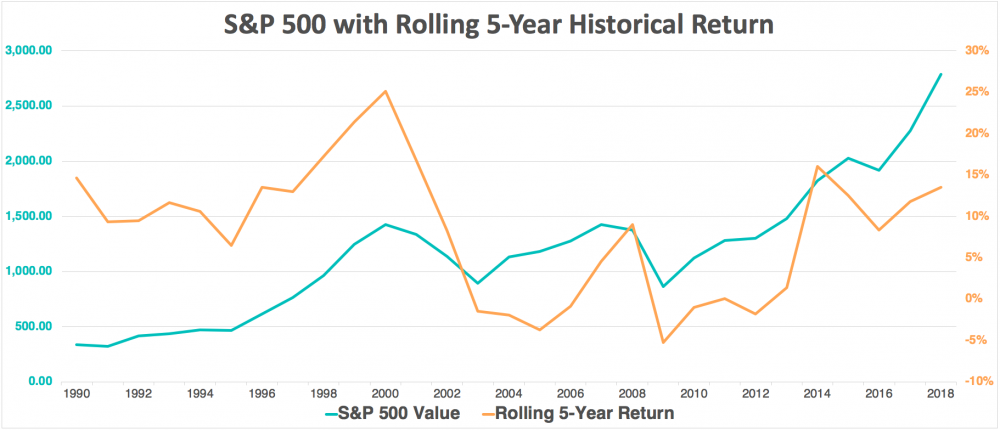
The blue line above represents the price of iShares’ S&P/TSX 60 Index ETF (adjusted for dividends & splits). The green line represents the iShares’ Canadian Government Bond Index ETF, and the red line represents iShares’ 20-year US Treasury Bond ETF. The chart starts at the left showing only the TSX 60 ETF. As you can see, TSX 60 ETF starts dropping in the middle of 2008 and falls almost straight down for an entire year. Once the blue line reaches its lowest point in February 2009 I introduce the two bond ETFs to give you a sense of what a recovery would be like had investors either stayed the course and held on to their stocks (in blue) or swapped into bonds (in green & red). It is important to note, that had investors had the intuition to transition into bonds prior to the crash (or held a diversified portfolio) they wouldn’t have experienced such a dramatic loss. But that certainly wouldn’t have been possible for any investor who took their investment cues from posters, as the bond fund poster wasn’t even displayed until 2009.
The period between 2007 and 2010 played a crucial role in developing my understanding of market cycles, investor psychology, risk management and the important of due-diligence. Unfortunately, for many investors, that same period in history represents huge financial losses and emotional pain. It is important to note that similar posters to the ones displayed in my branch were also displayed in our competitors branches as well. I’m also not insinuating that there was any foul play with respect to the odd timing of the posters. We expect companies to want to advertise when their products are performing well. Markets tend to move in cycles, but ironically, the length of those cycles just so happens to approximately the amount of time it takes for many investors to take notice and get on board. This has the effect of pulling the rug out from those that are late to the party.
For almost a decade I’ve been pondering the events I witnessed as a bank teller between 2007 & 2010. I’ve come to the conclusion that: having a lack of financial literacy was what hurt regular investors most. Most people are not taught how to interpret technical and fundamental market data. When it comes to purchasing a consumer item most people find it easy to spot a deal, or a fad, but when it comes to financial products most untrained investors seem to reverse the two. The consequences of having a lack of financial literacy are amplified when emotion is involved. The mood of investors seems to mimic the cyclical nature of markets by oscillating between the emotions of greed and fear. I observed this first hand when so many investors rushed to invest in my branches equity fund at the top of the stock market just because they saw a poster showcasing how great their returns would have been had they invested five years earlier. Many of those same investors panicked in fear and sold out of their stock investments after experiencing dramatic losses, only to trade into GICs that paid almost zero return (but promised a “guarantee of principal”). Finally, some investors then missed out on one of the longest bull-markets in recorded history because they were either on the sidelines stuck in safer GICs or because they were lured into bonds by yet another poster showcasing how great their return would have been had they invested five years earlier.
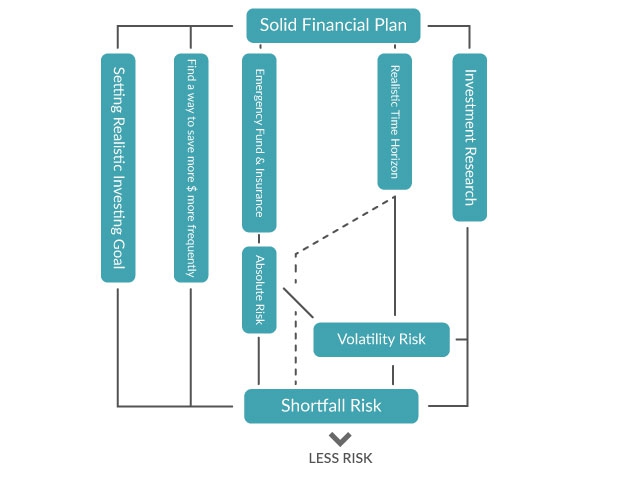
For most people, investing is deeply connected to their present & future quality of life. That’s why it is almost impossible to completely separate emotion from investing. Having an understanding of financial literacy (or aligning with an advisor who is financially literate) can help investors temper their reactions to highly emotional situations. The other tool all investors should leverage is a solid financial plan. A strong financial plan can help investors to never lose sight of their goals. Its principles aren’t eroded by the cacophony of conflicting market commentary investors are subjected to on a daily basis. Although I’ve been studying markets and investing for about 15 years the most important lessons I’ve learned came from my short time as a bank teller observing how clients reacted to the posters on display during the beginning, middle and end of the 2008 Financial Crisis. Despite still being tempted by my own emotions during periods of market euphoria and hysteria, I’m reminded to stick with my financial plan and beware of the writing on the wall.
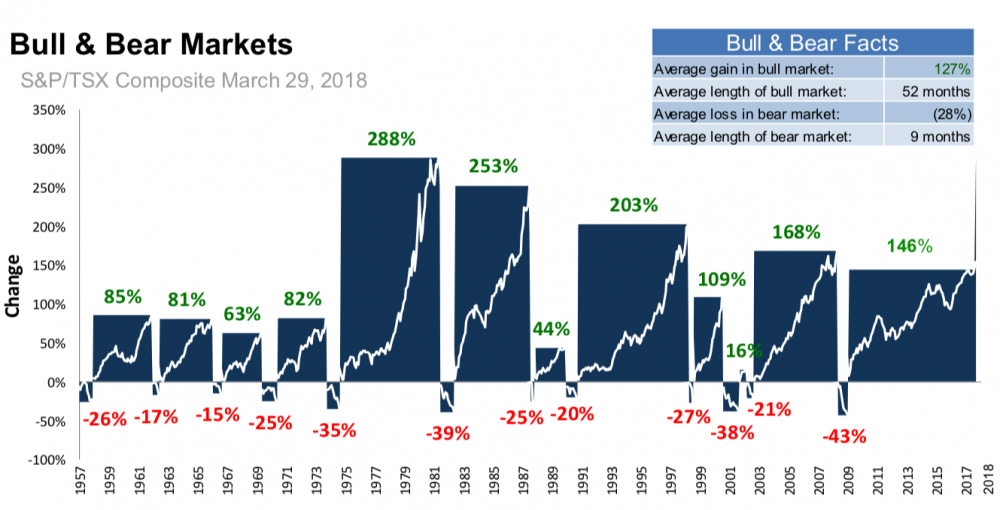
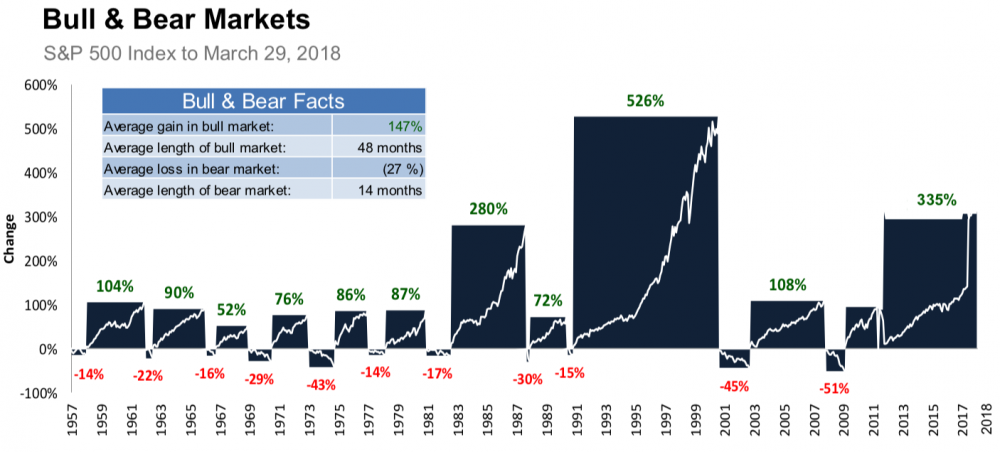 Source: mackenzieinvestments.com Original Source: Bloomberg March 2018